Covid Stats as of 10/15/20
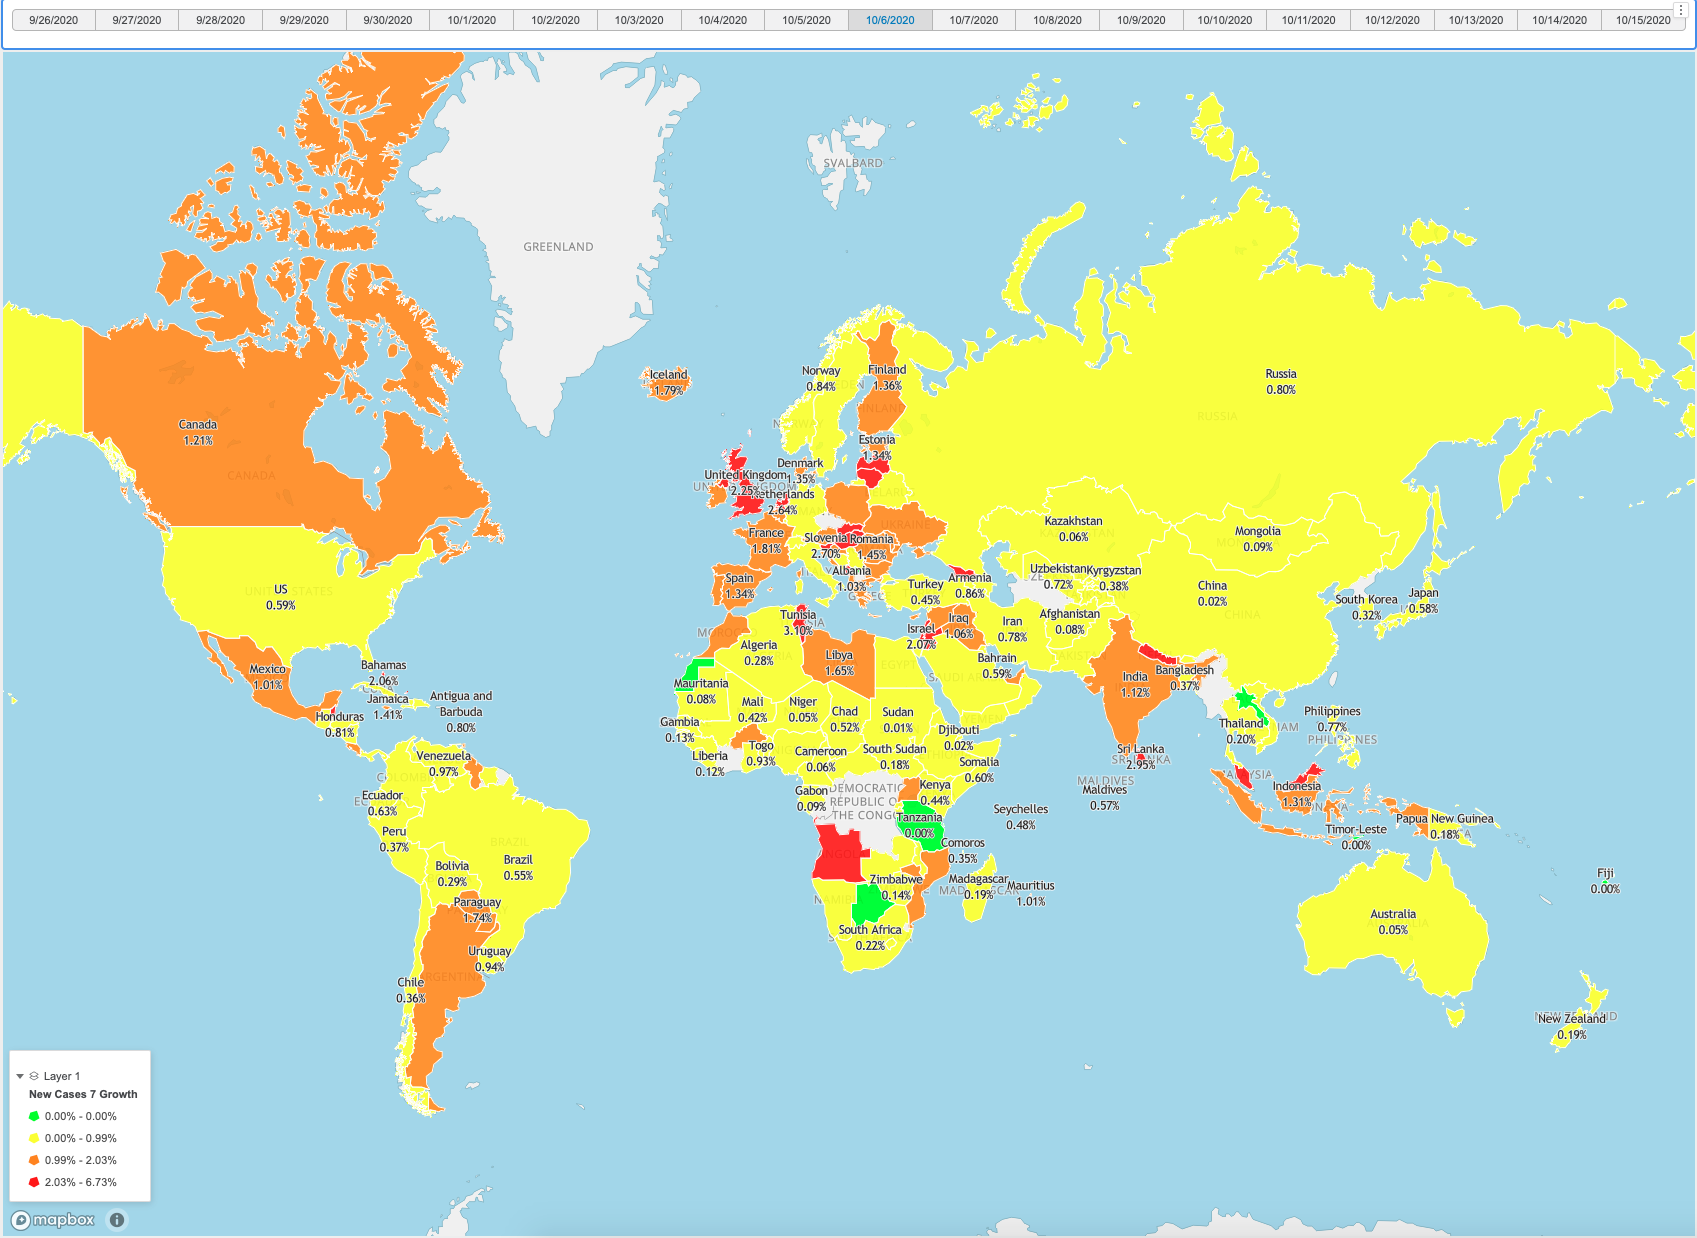
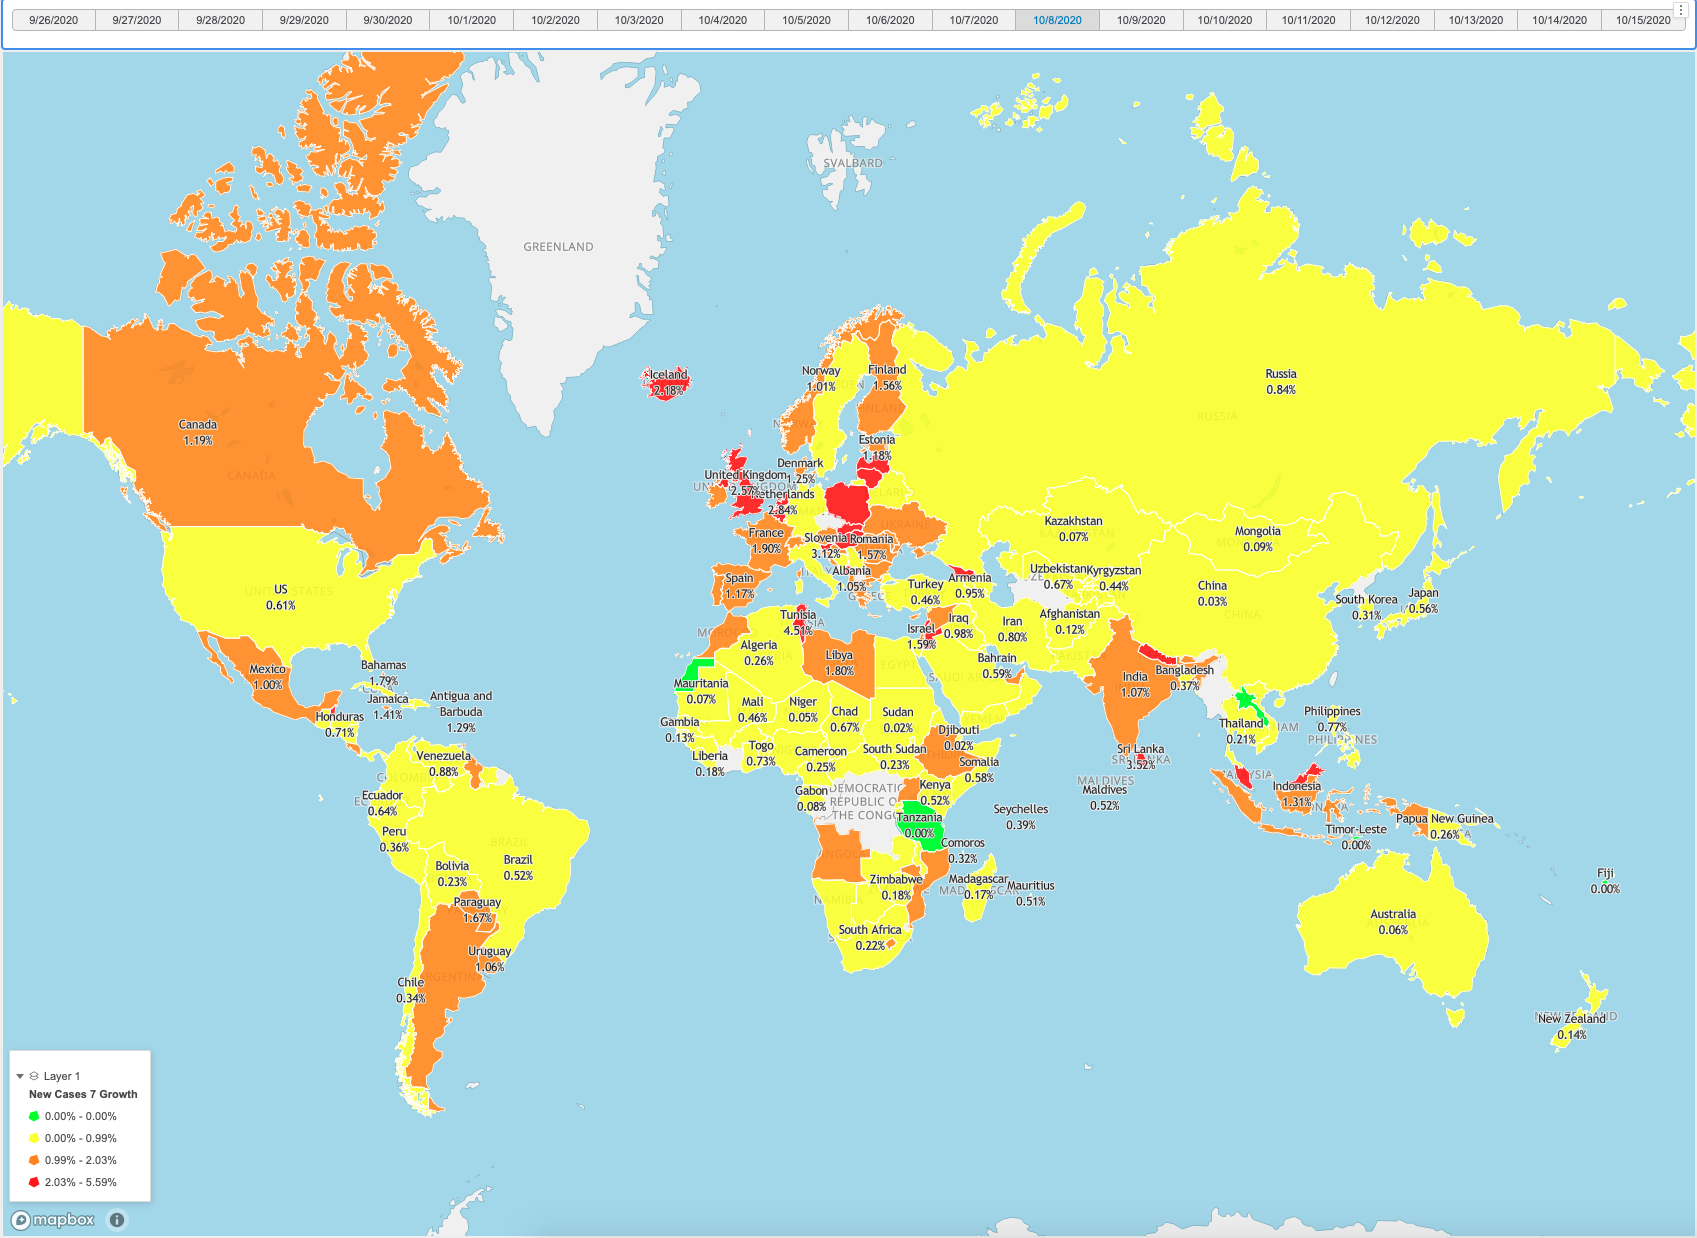
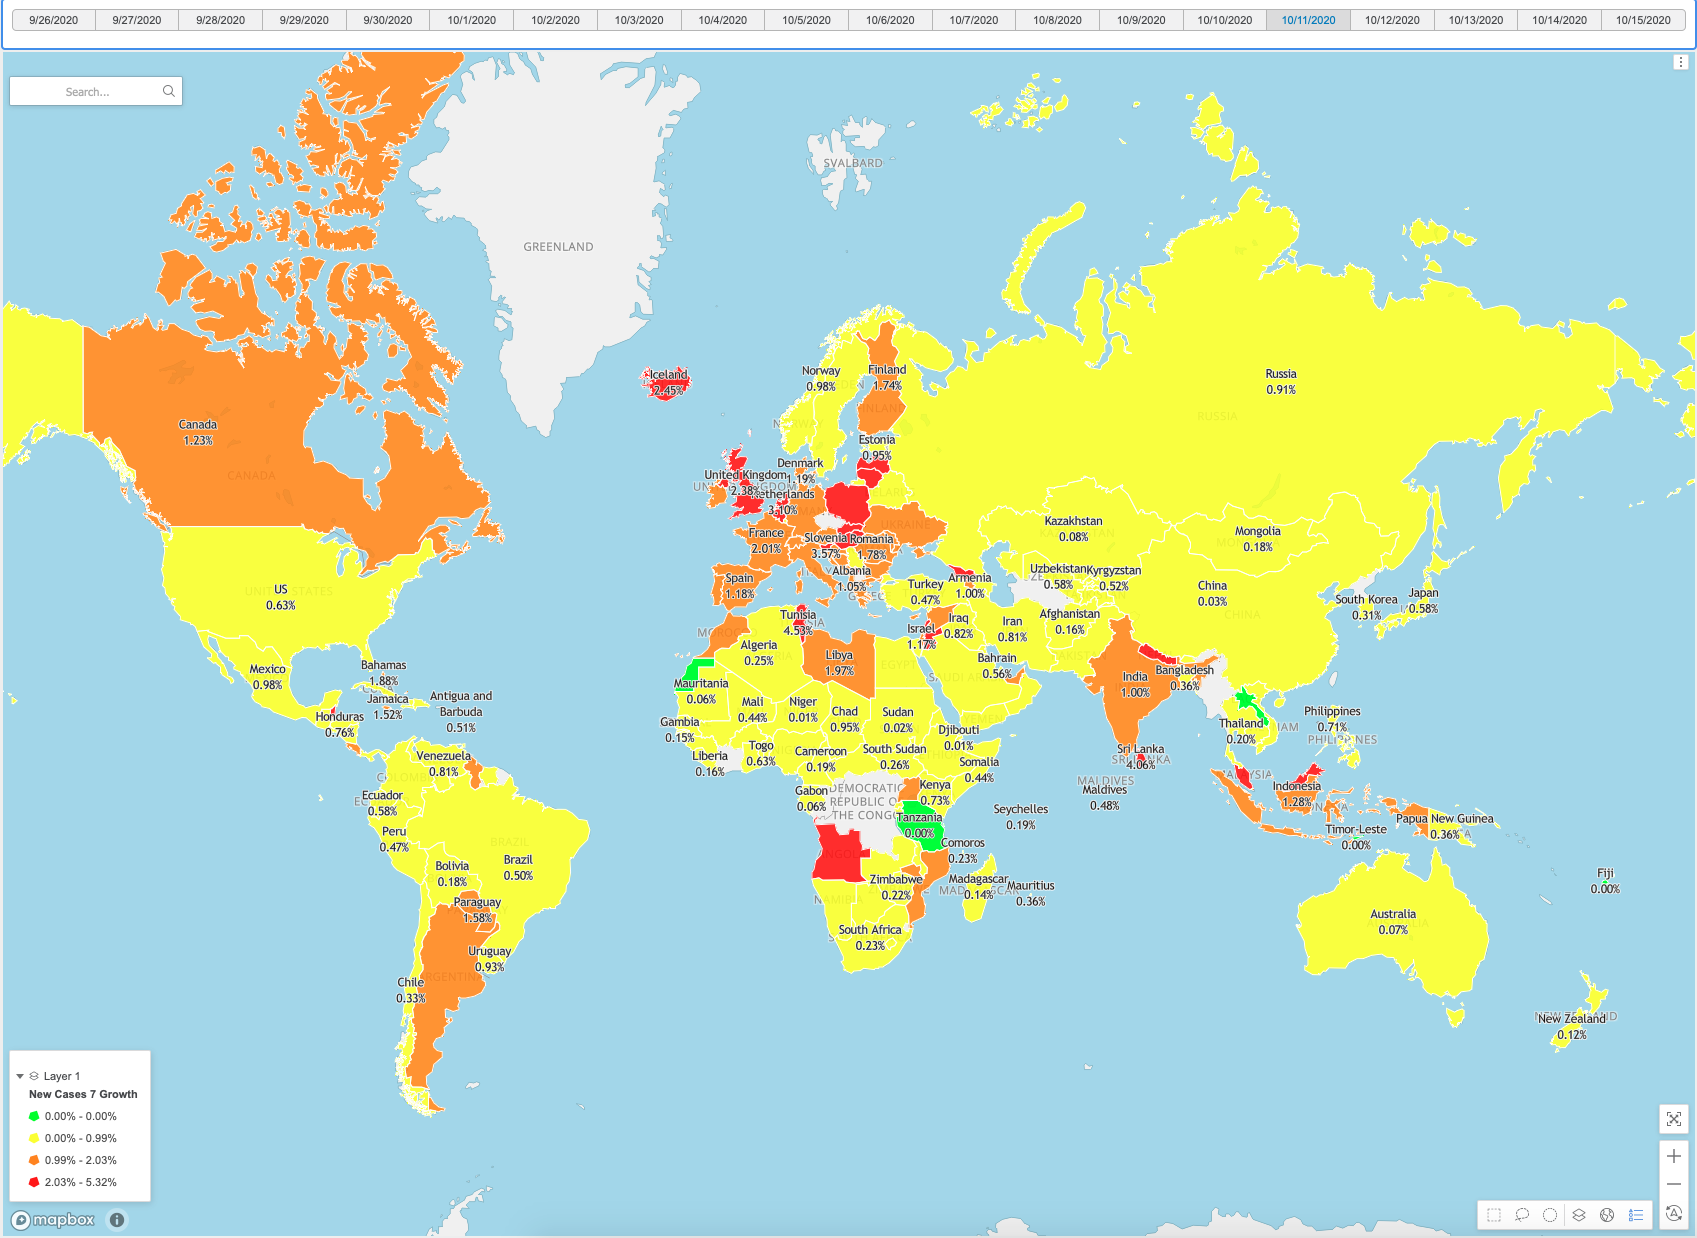
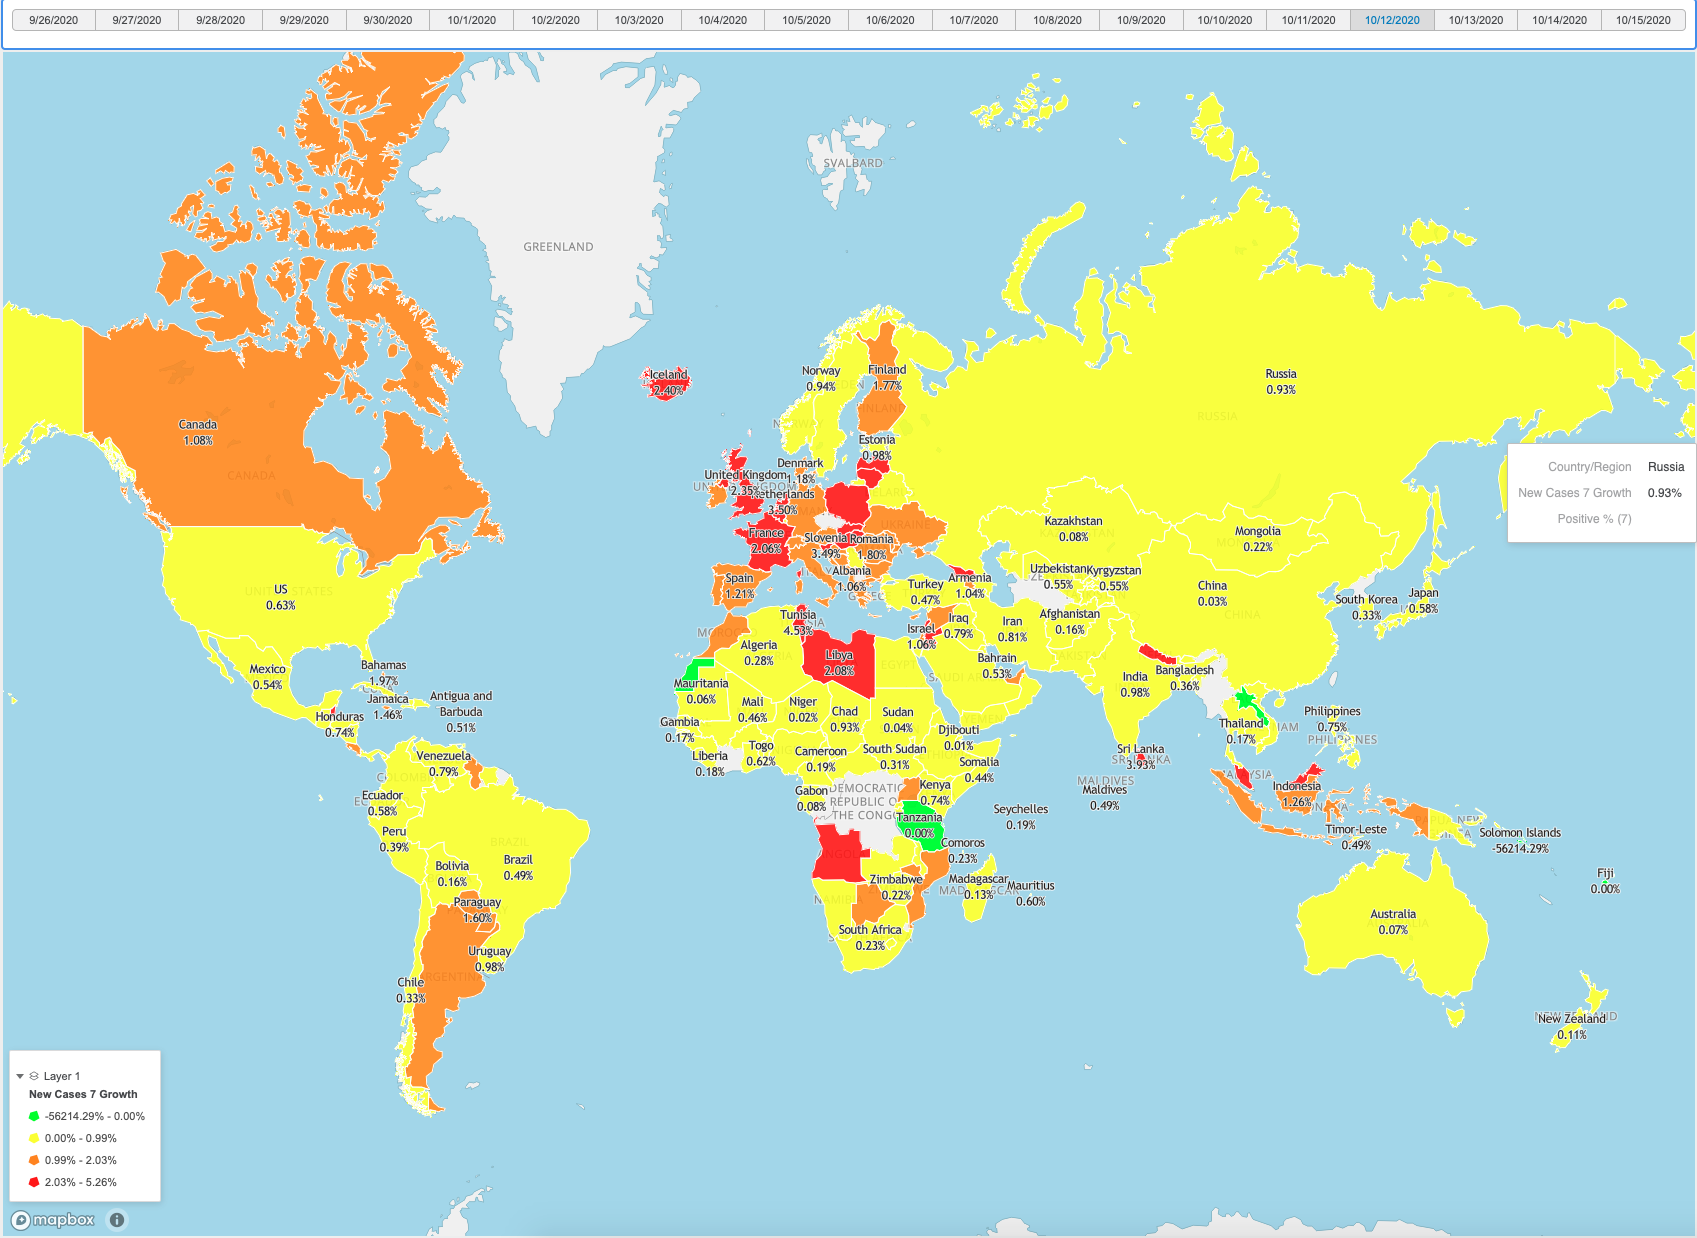
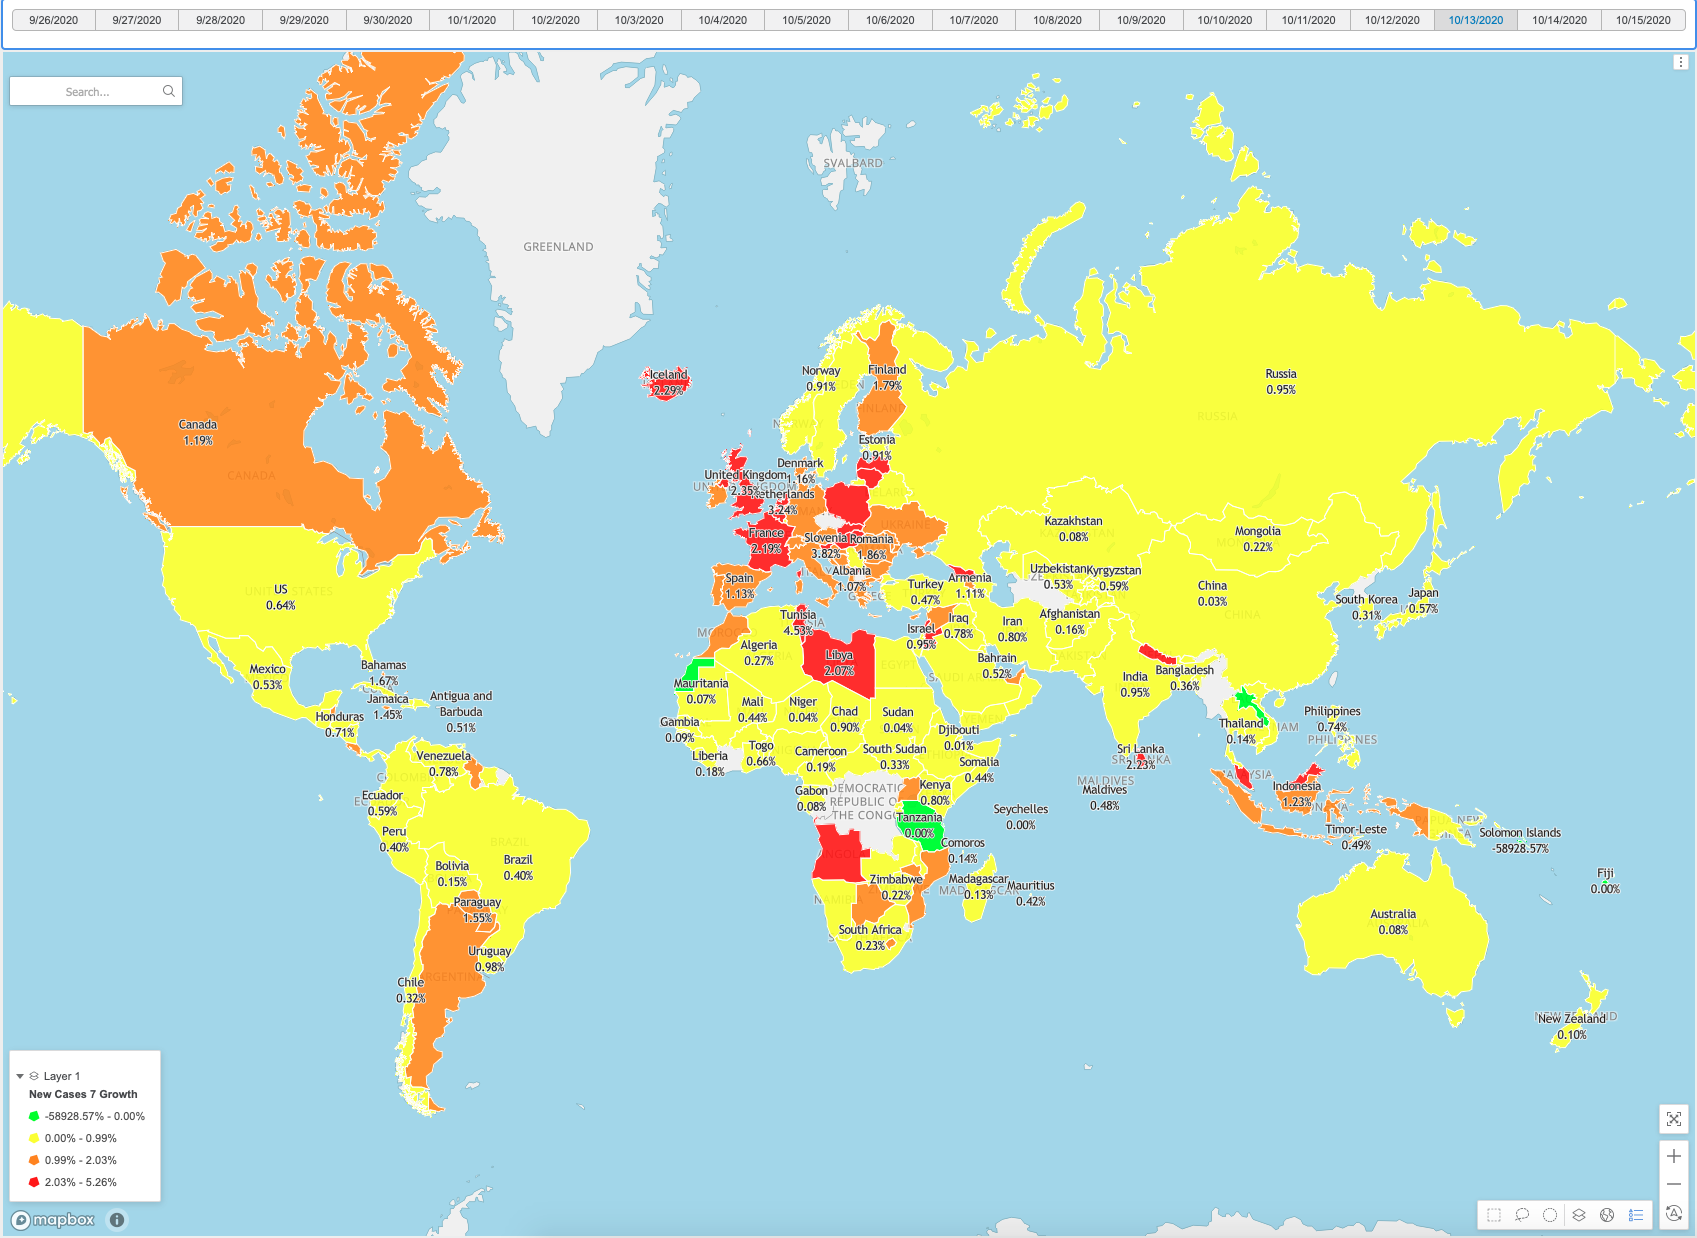
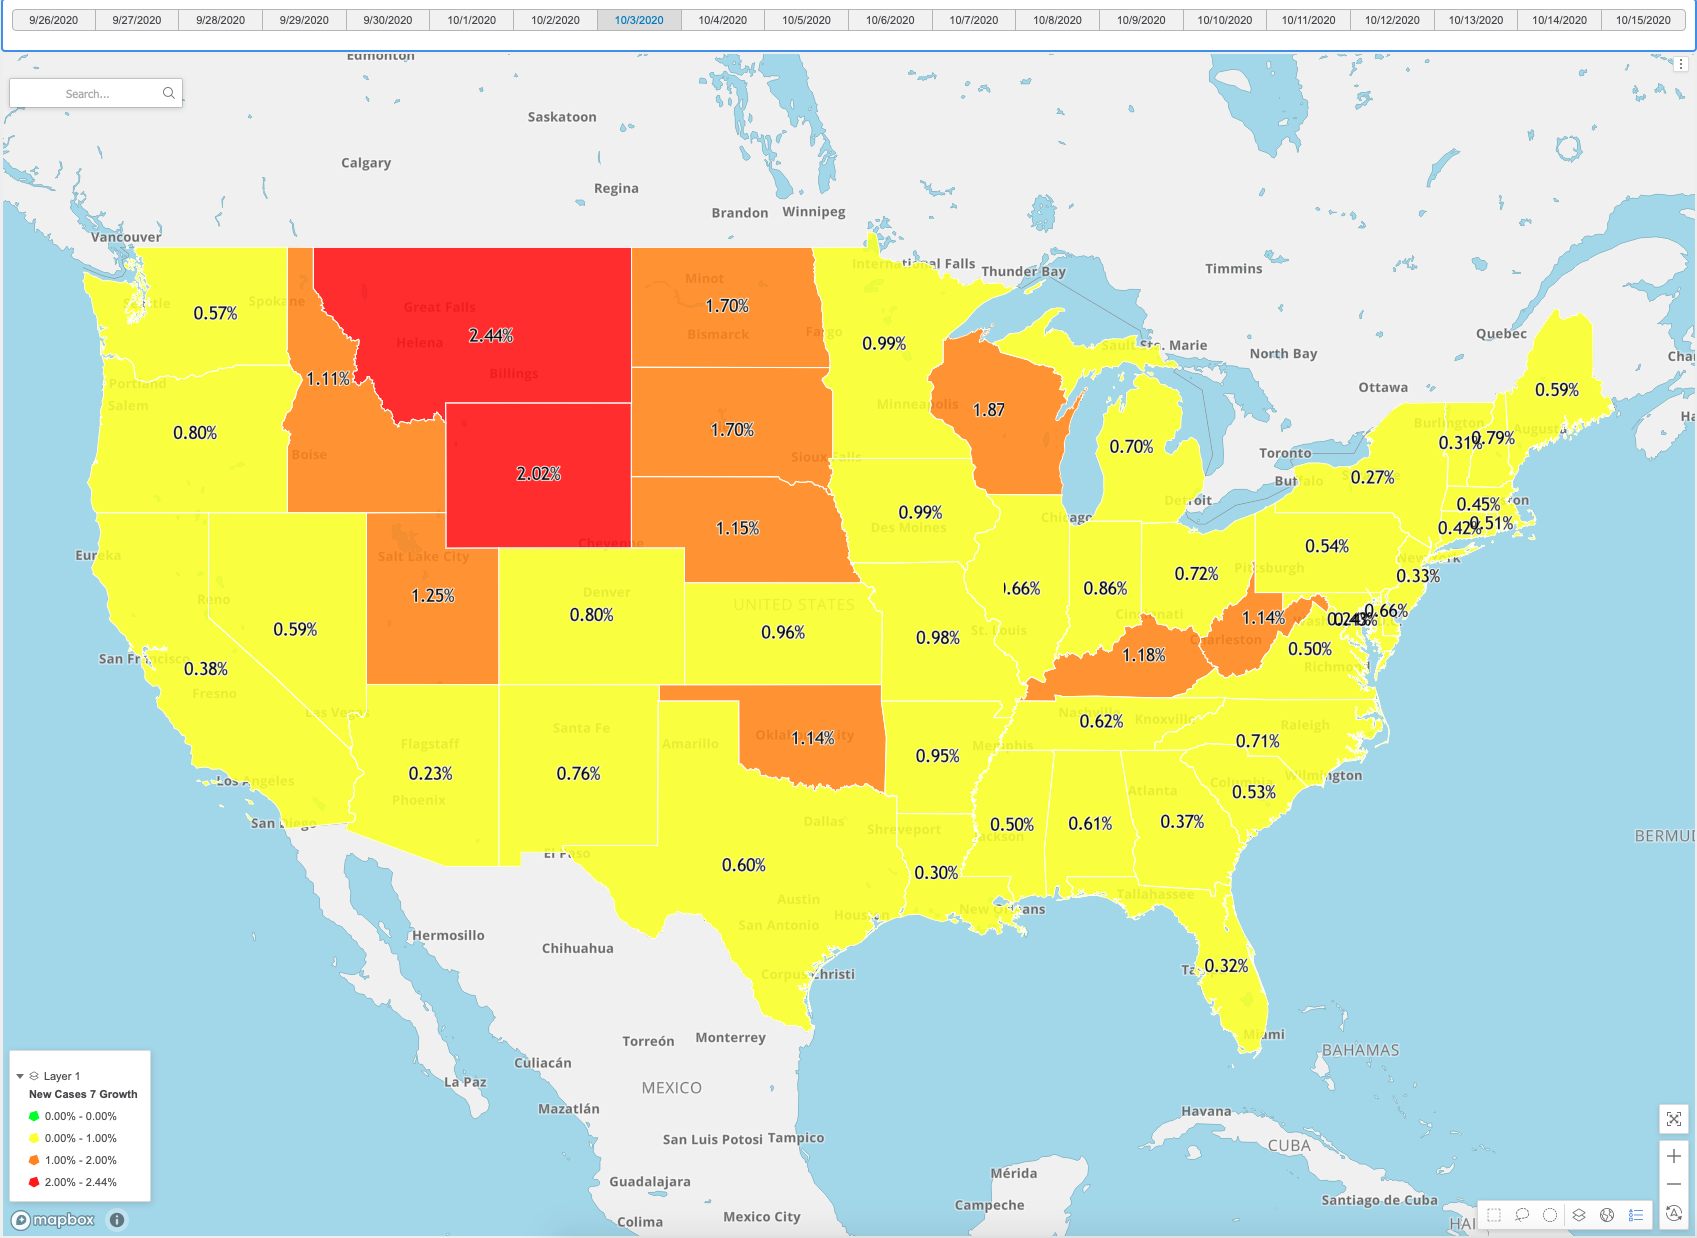
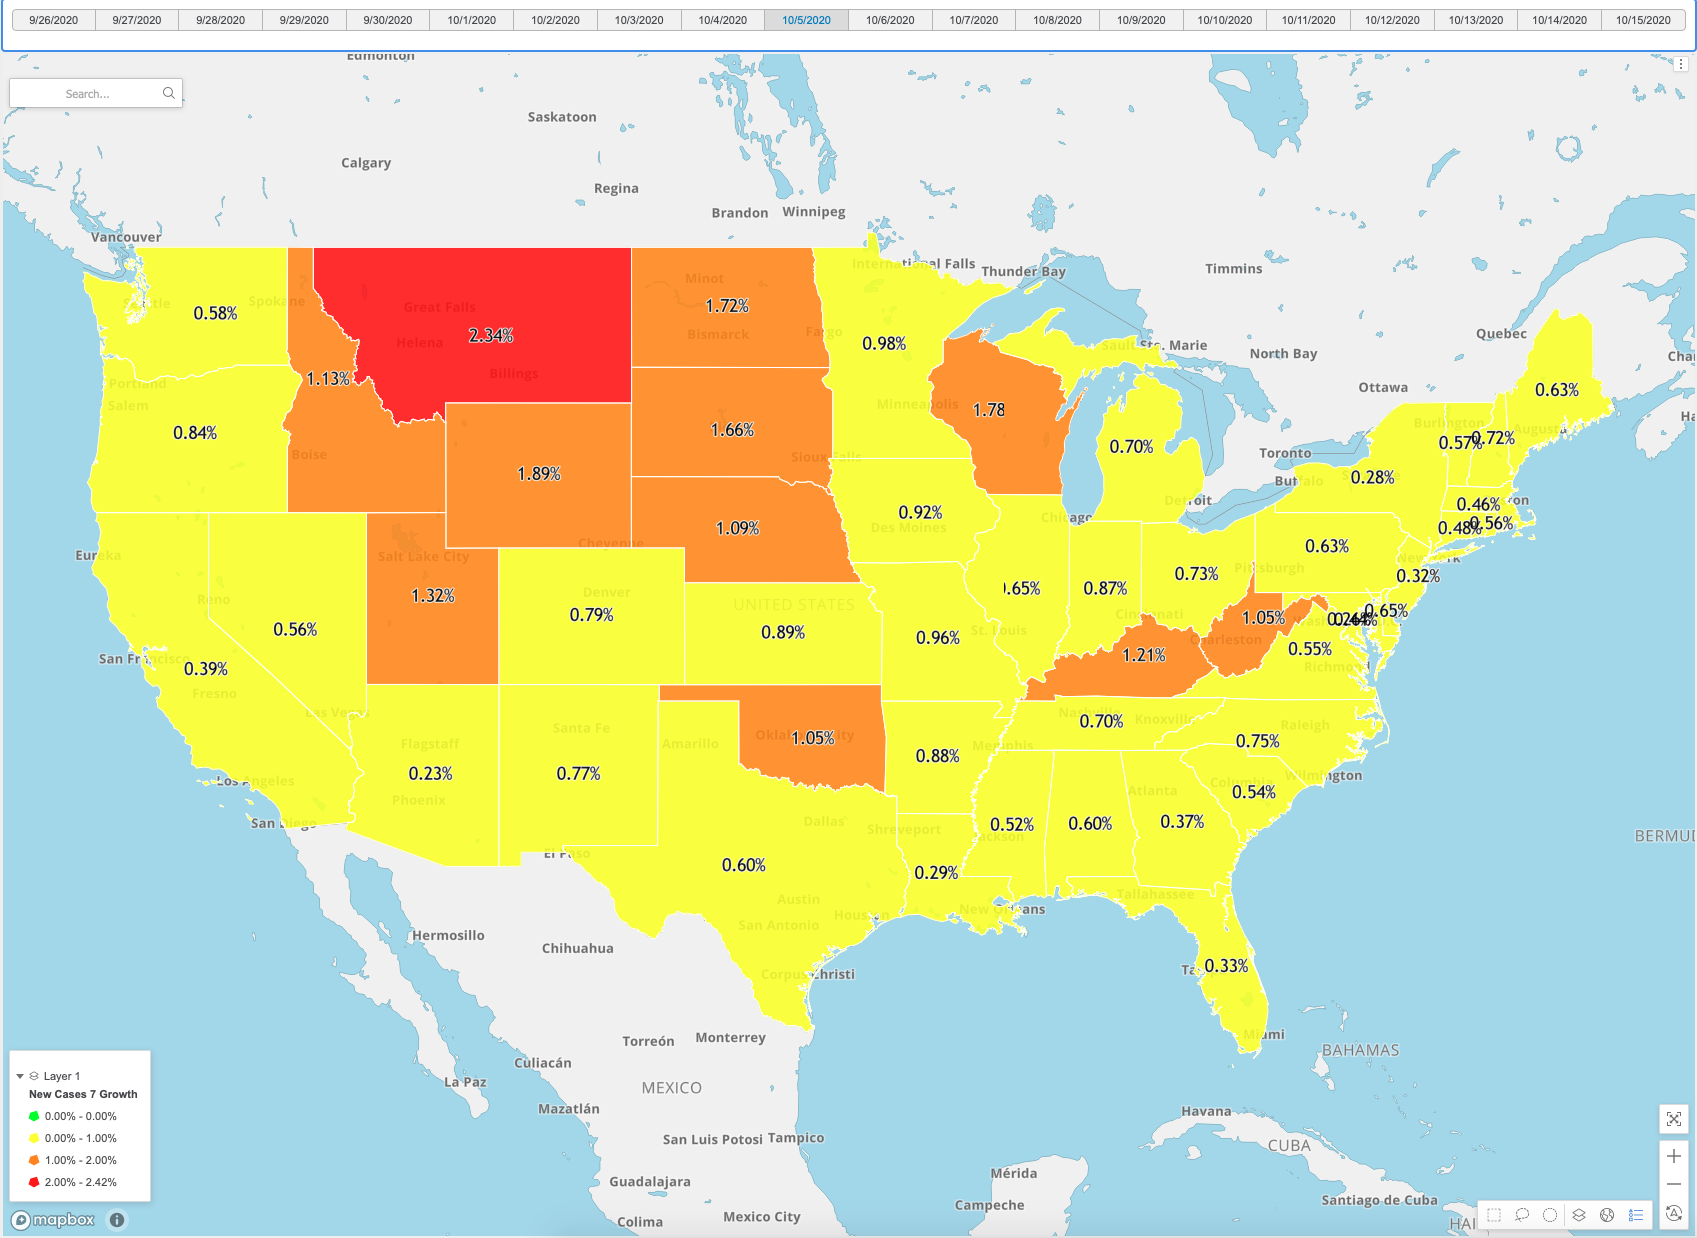
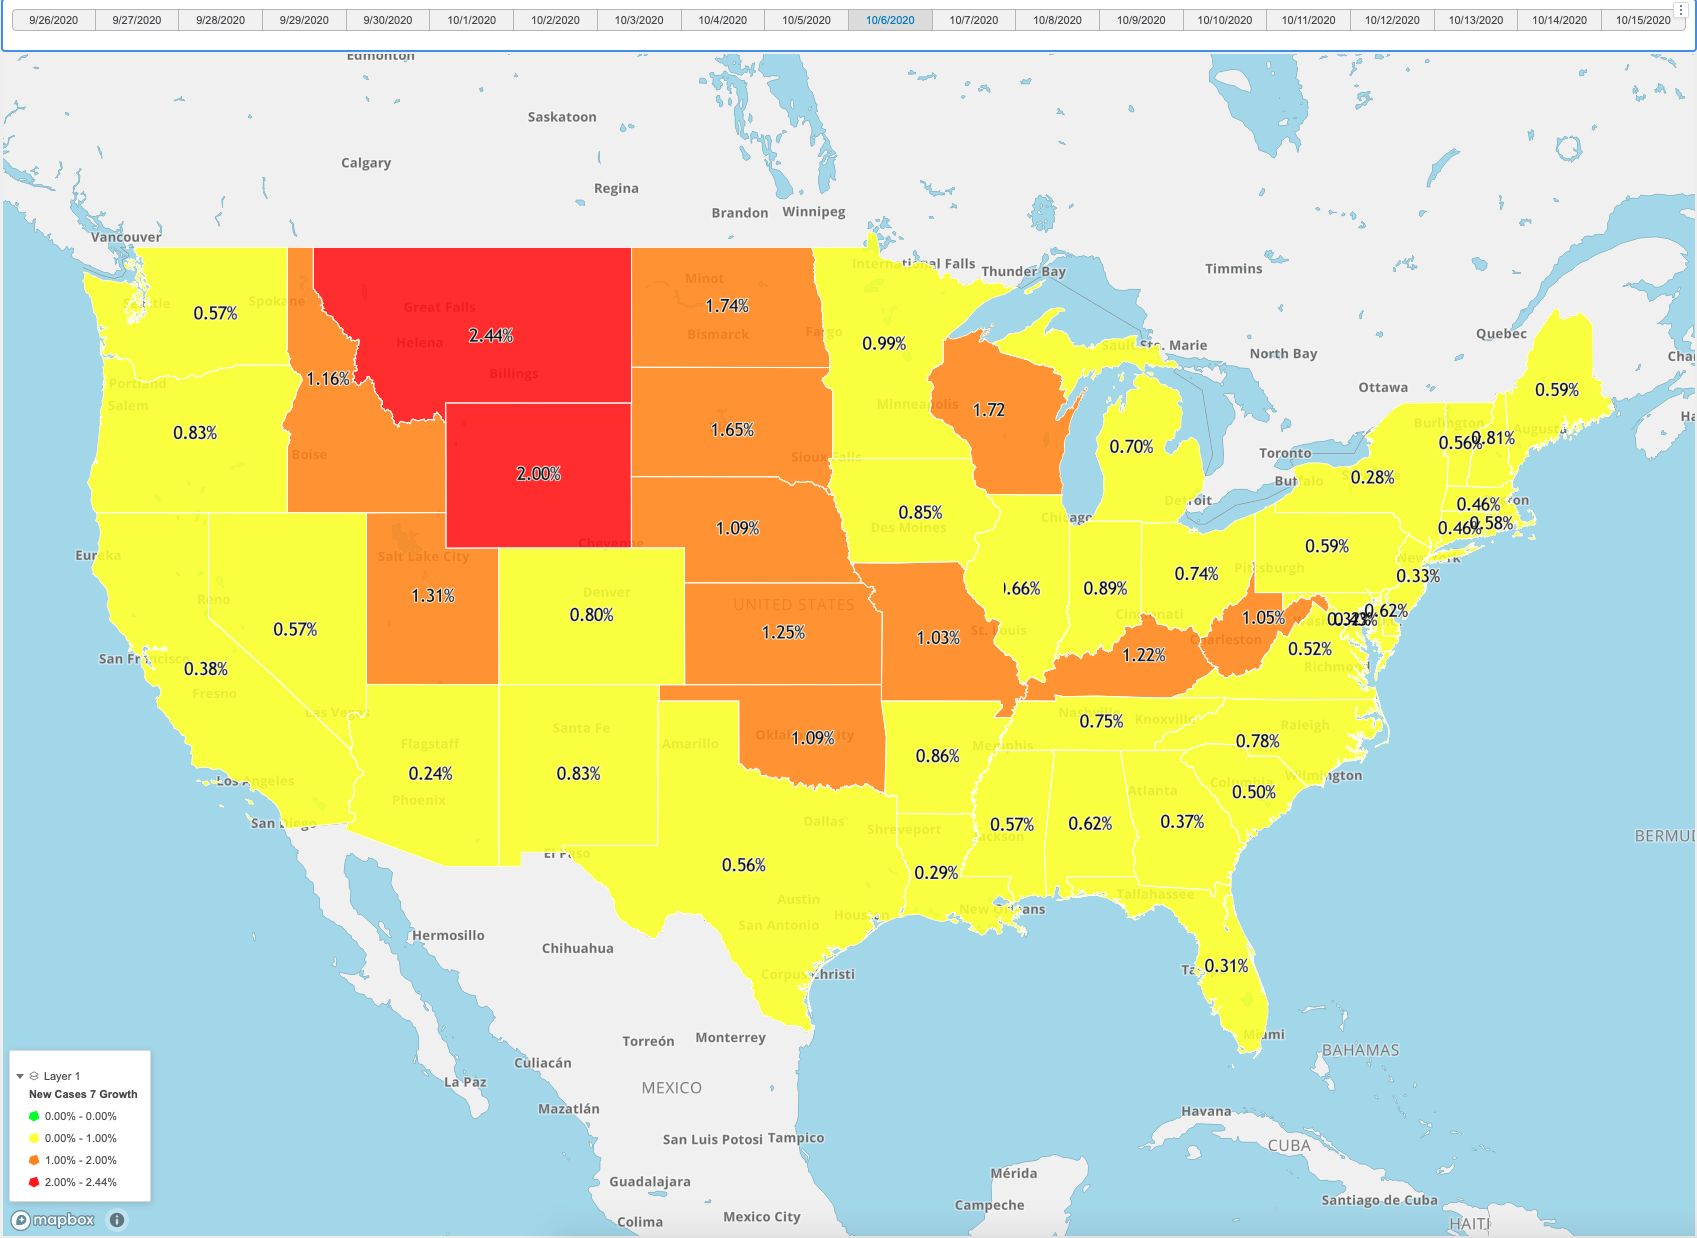
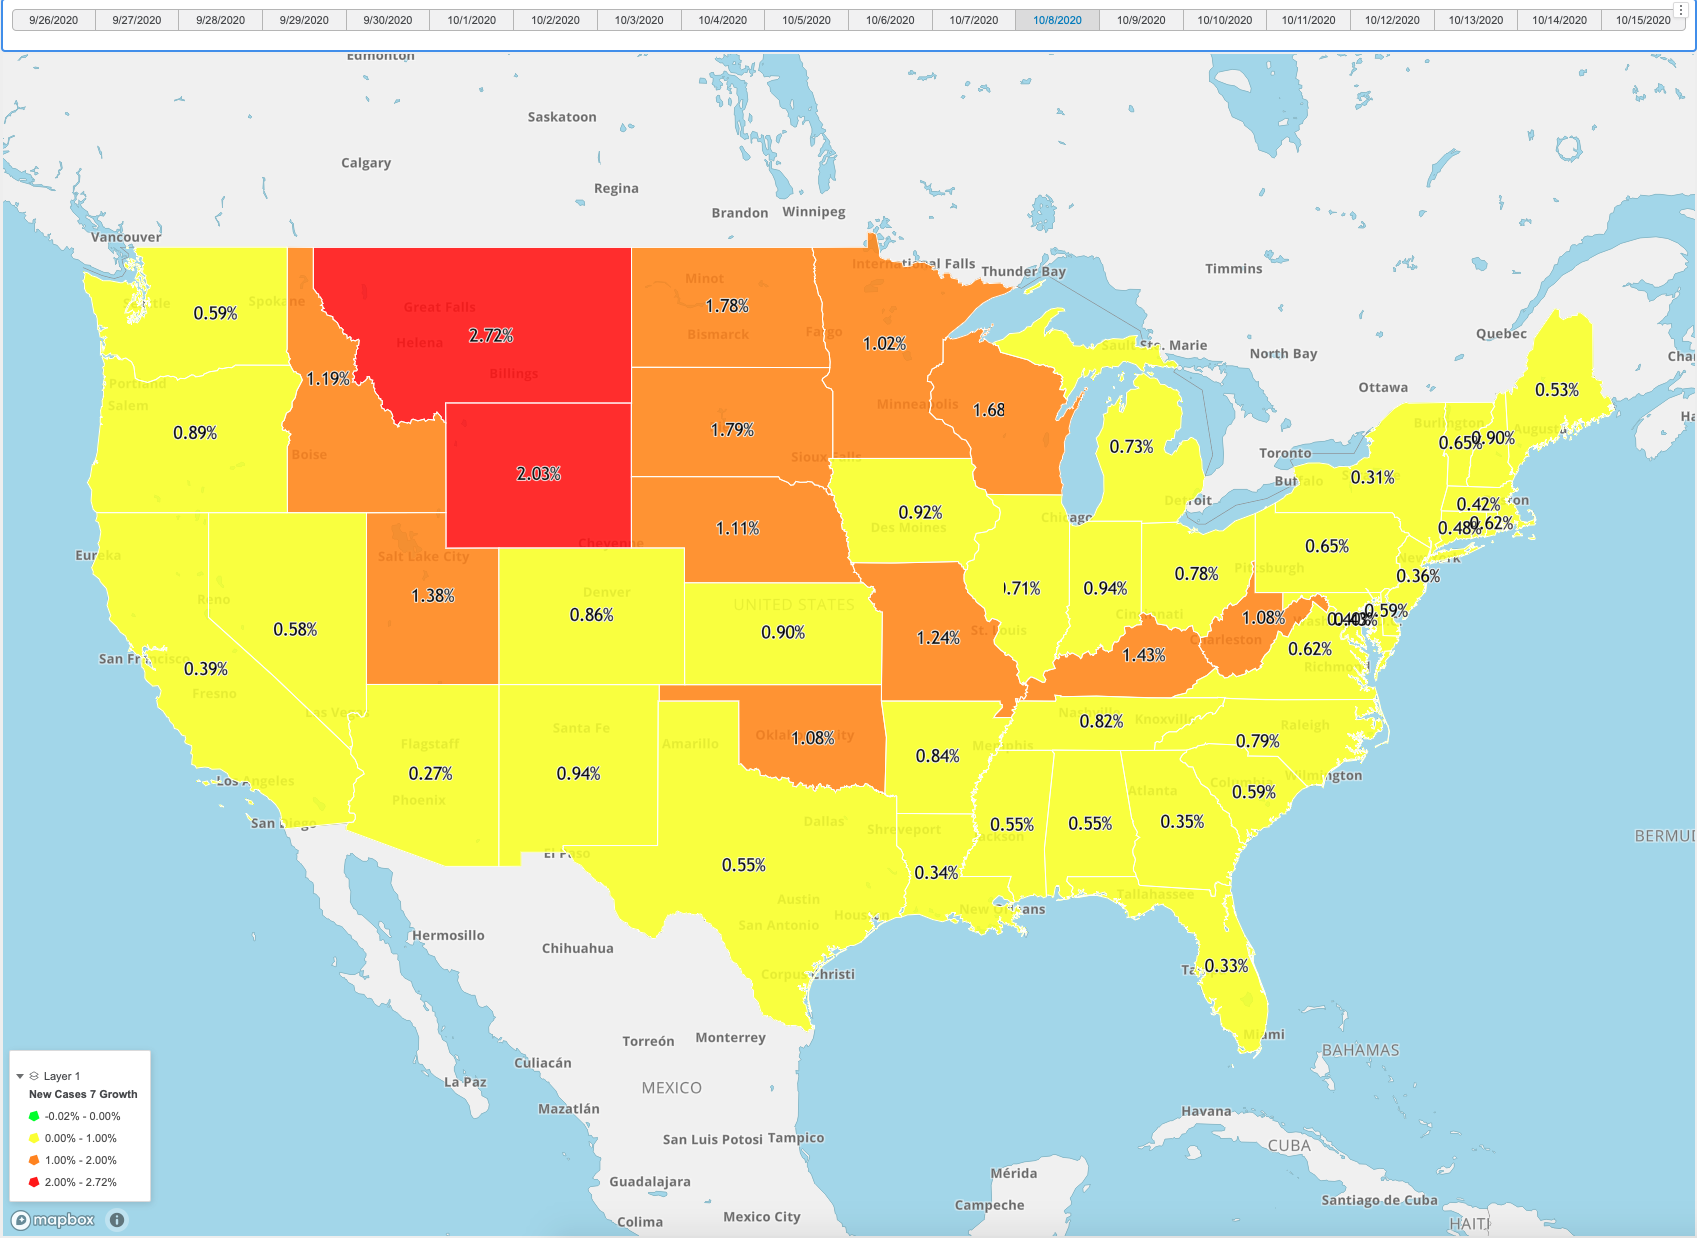
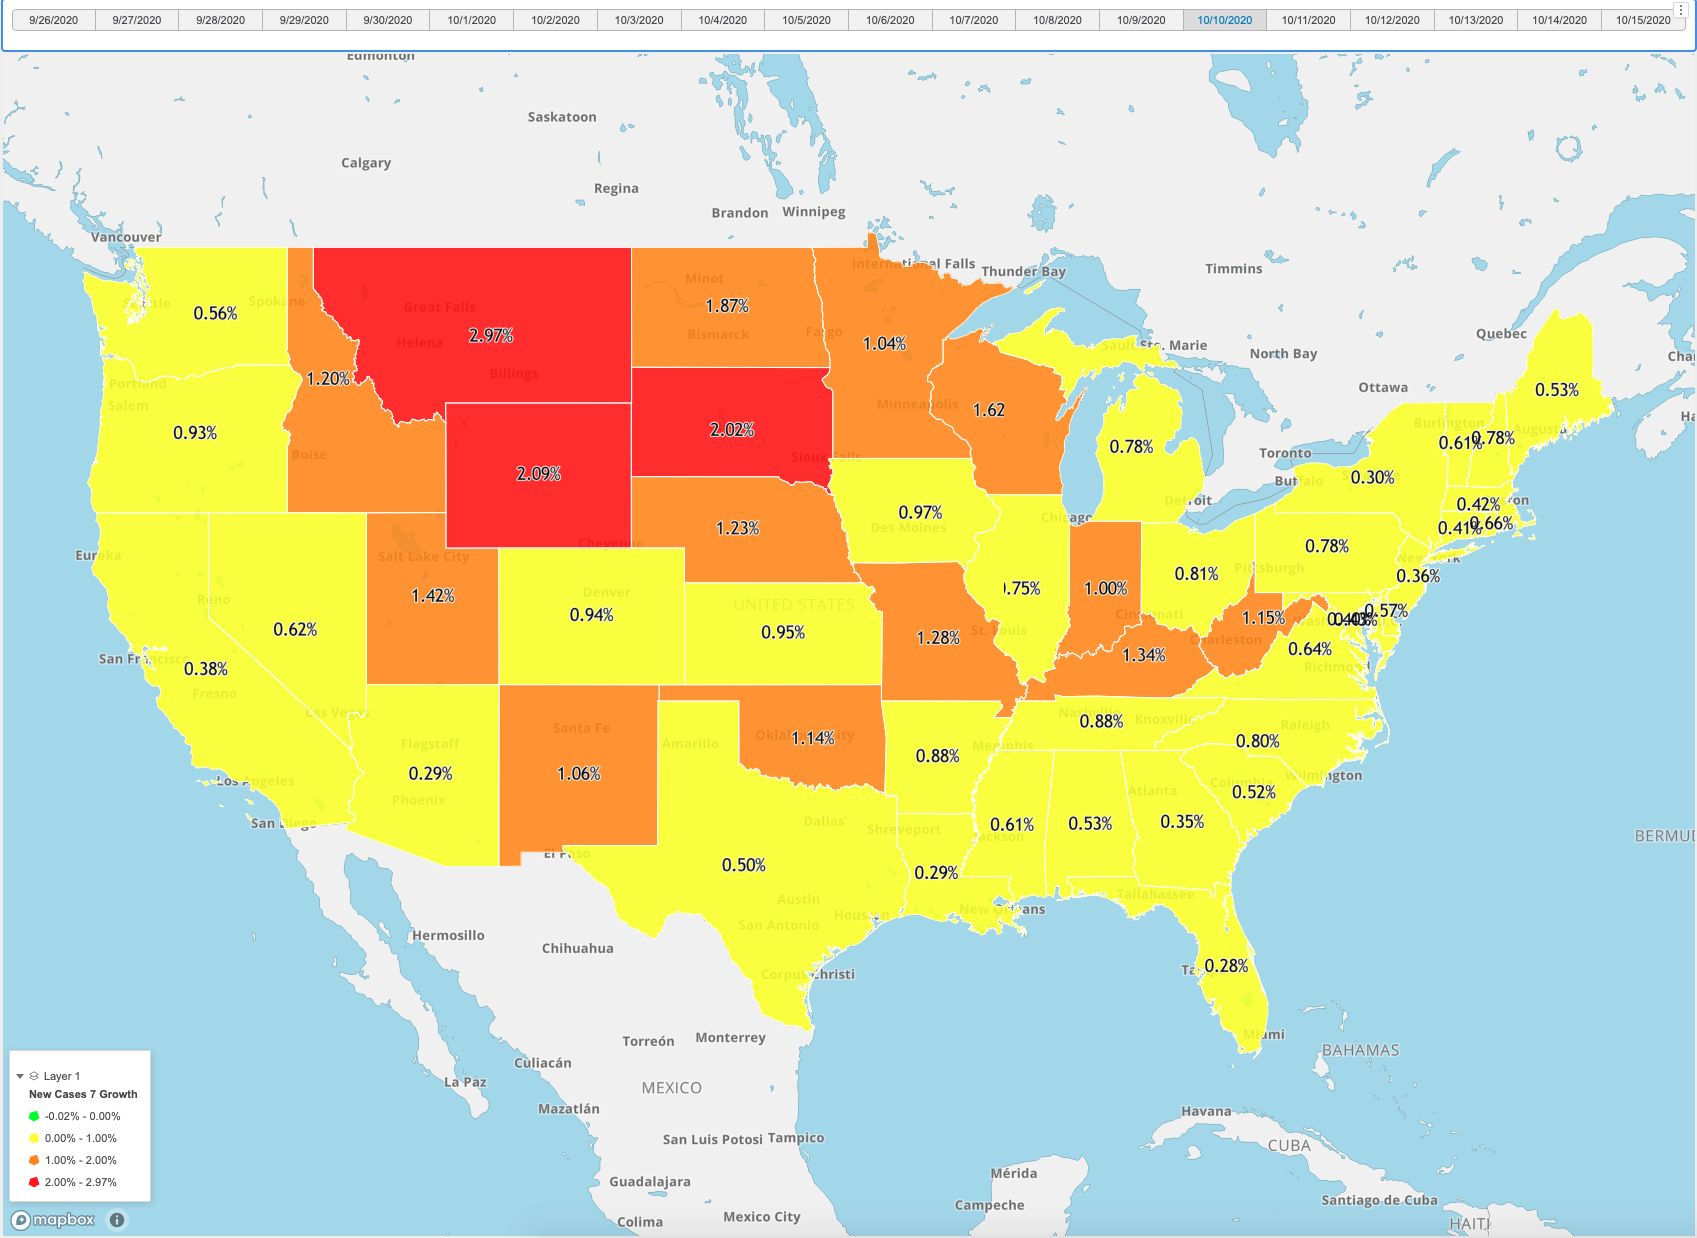
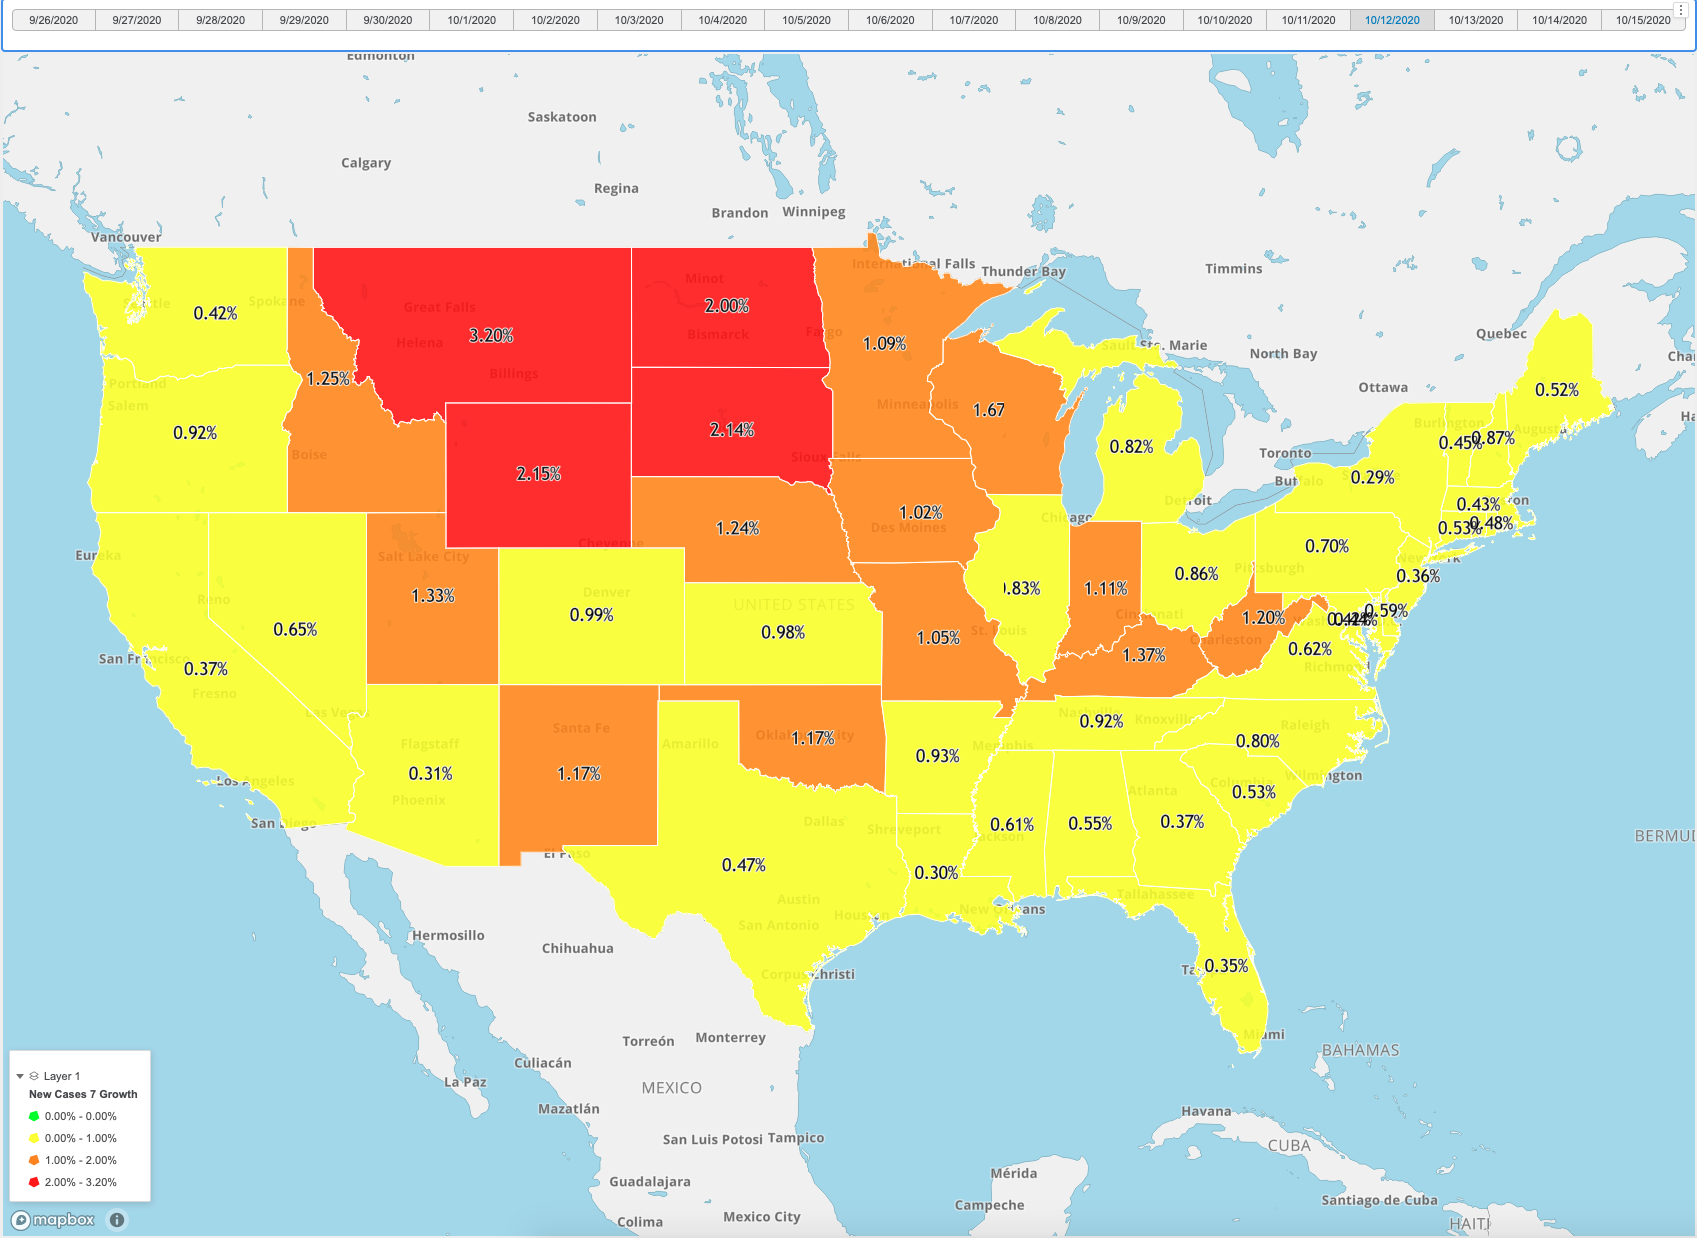
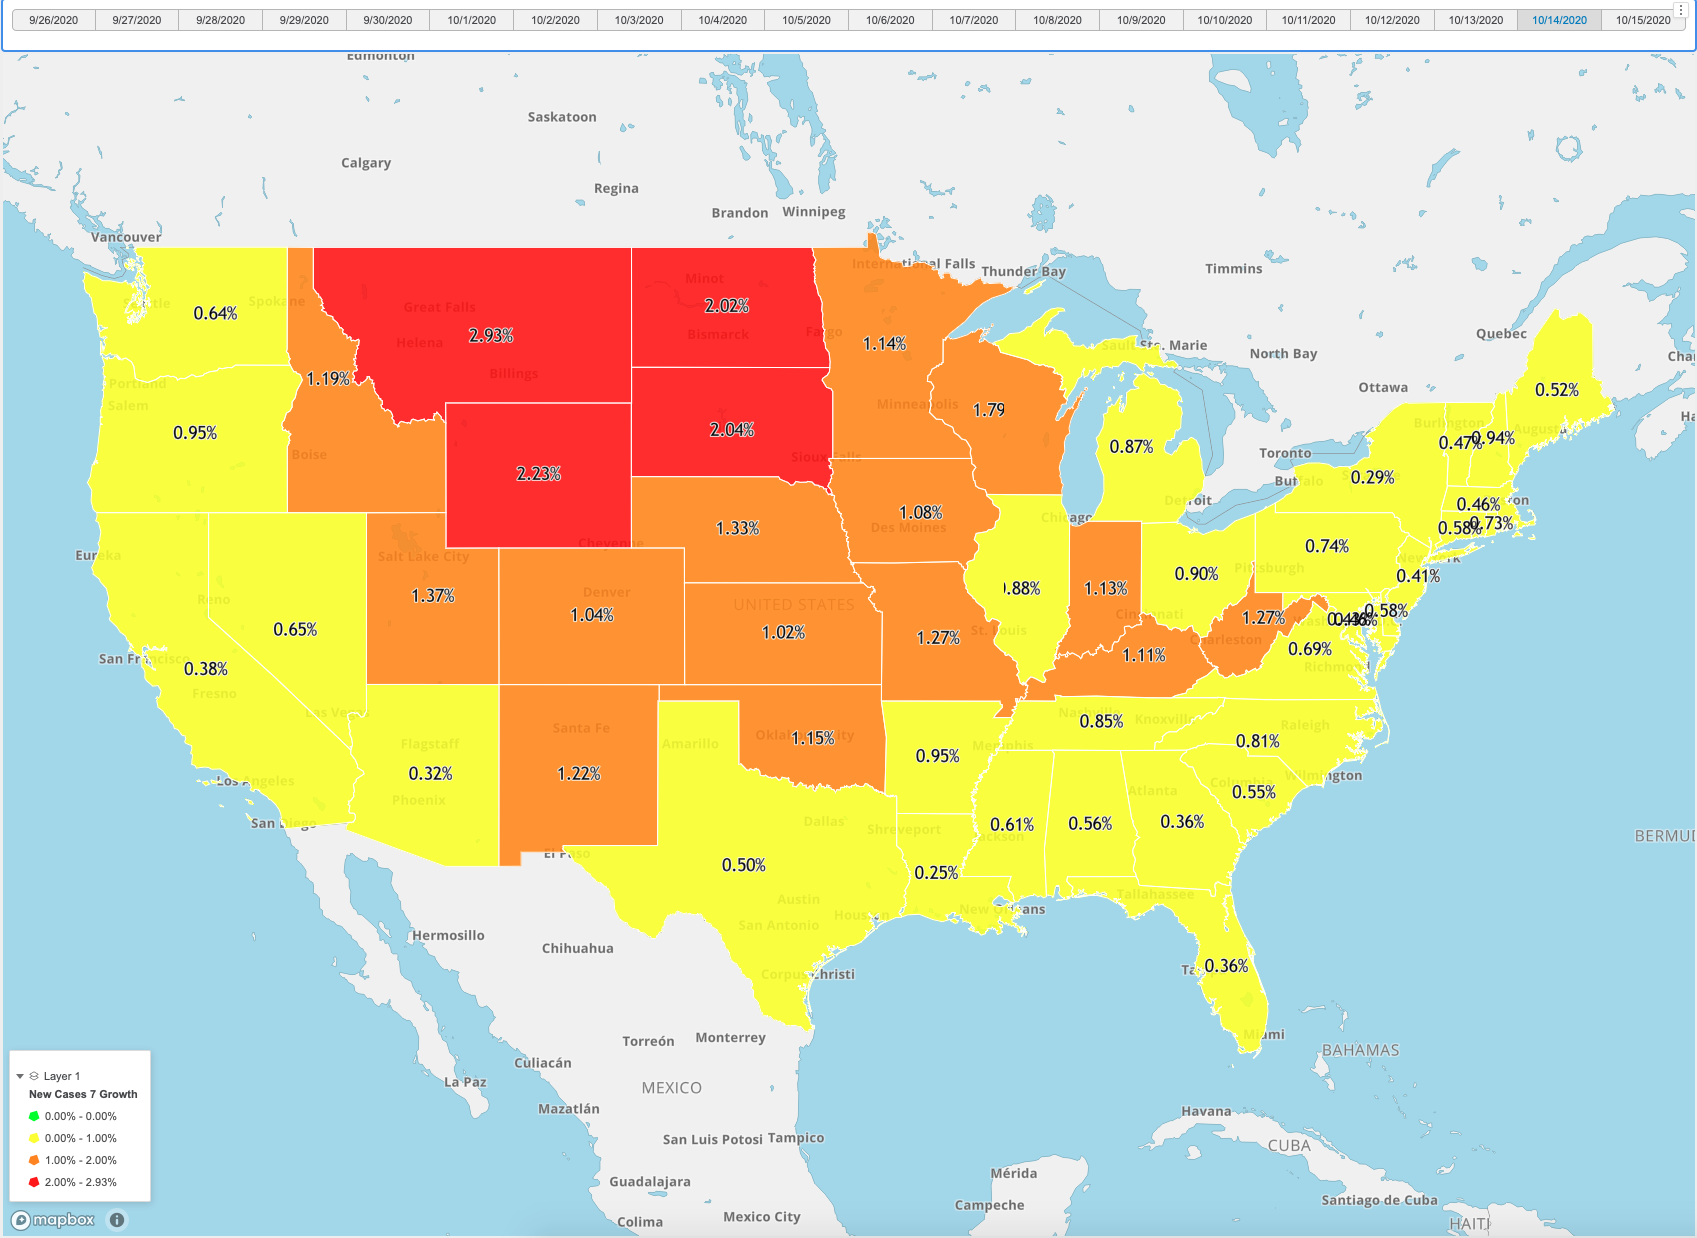
Hello everyone! I took a little hiatus but am back with some interesting stats today. I’ve been pulling the numbers every day, just not posting any results. I’ve retooled the numbers to look at trends for new cases and % positive with a 7 day average, to take out the lumpiness of day to day reporting. I’ve also provided a map view of the past two weeks so you can see the progression in the middle of the US, and also middle Europe. Trends have slowly started to increase, and although age demographic data is hard to come by, I believe it is the 18-29 age group that is increasing the fastest, which would lead you to believe most of the growth is attributable to school re-openings. Bars, gyms, restaurants and pandemic-fatigue play into it as well, but my guess is that it is the schools that is driving most of it.
Most troubling is the increase in hospitalizations and deaths. I’m going create some 7-day averages for deaths for future analysis.
Hope everyone is well!
US 7 Day Average Case Growth and Positivity Rate
US 7 Day Average Case Growth, by day


World 7 Day Average Case Growth, by day